500+
organisations, representing US$17.7 trillion in assets under management, have committed to TNFD-aligned reporting.2
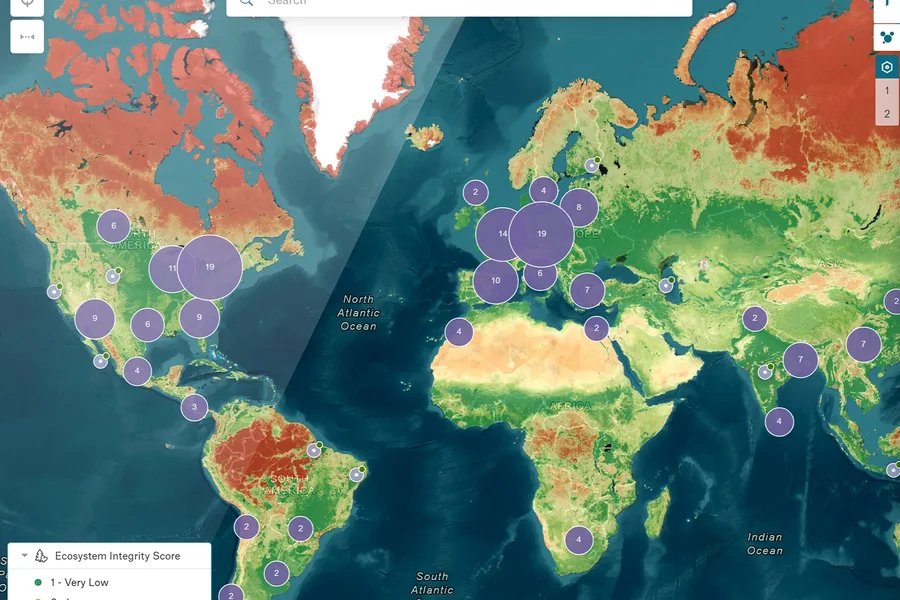
Pinpoint nature-related interfaces across assets, suppliers and value chains, with location-specific data aligned to TNFD, CSRD and the EU Taxonomy.
New and stricter rules such as CSRD and ISSB keep increasing the pressure to report comprehensively and transparently, and questions from a wide range of stakeholders are getting harder to answer. The data behind the answers sits in many different sources, and few teams have the time and people to gather it. Biodiversity and Nature Risk Edition brings it together in one place.
11
nature frameworks and regulations the scores are aligned to. Six apply to your own reporting, five to your banks, investors and insurers.1
Your reportingTNFDCSRDEU TaxonomyCSDDDNature Restoration LawEIA Directive
Your banks, investors and insurersSFDREBA Pillar 3ECBNGFSEIOPA
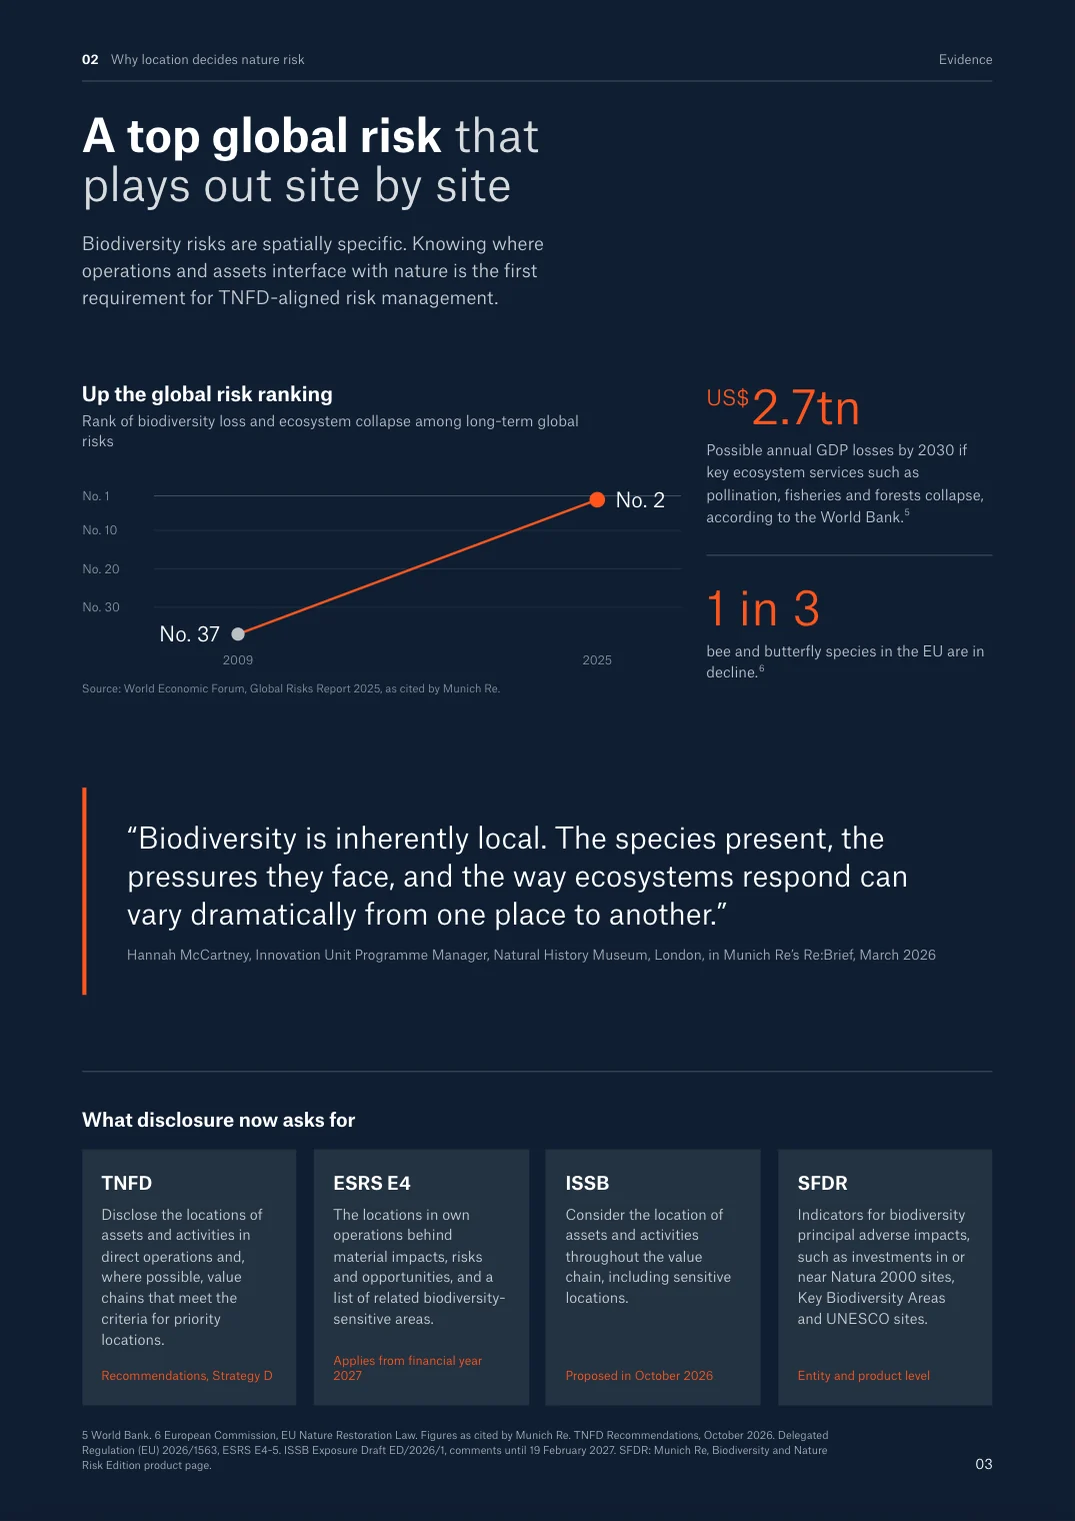
500+
organisations, representing US$17.7 trillion in assets under management, have committed to TNFD-aligned reporting.2
Every year
Rules like the CSRD require annual, assured reporting, so the analysis of your sites has to be repeatable.3
US$44tn
of economic value, more than half of global GDP, is moderately or highly dependent on nature.4
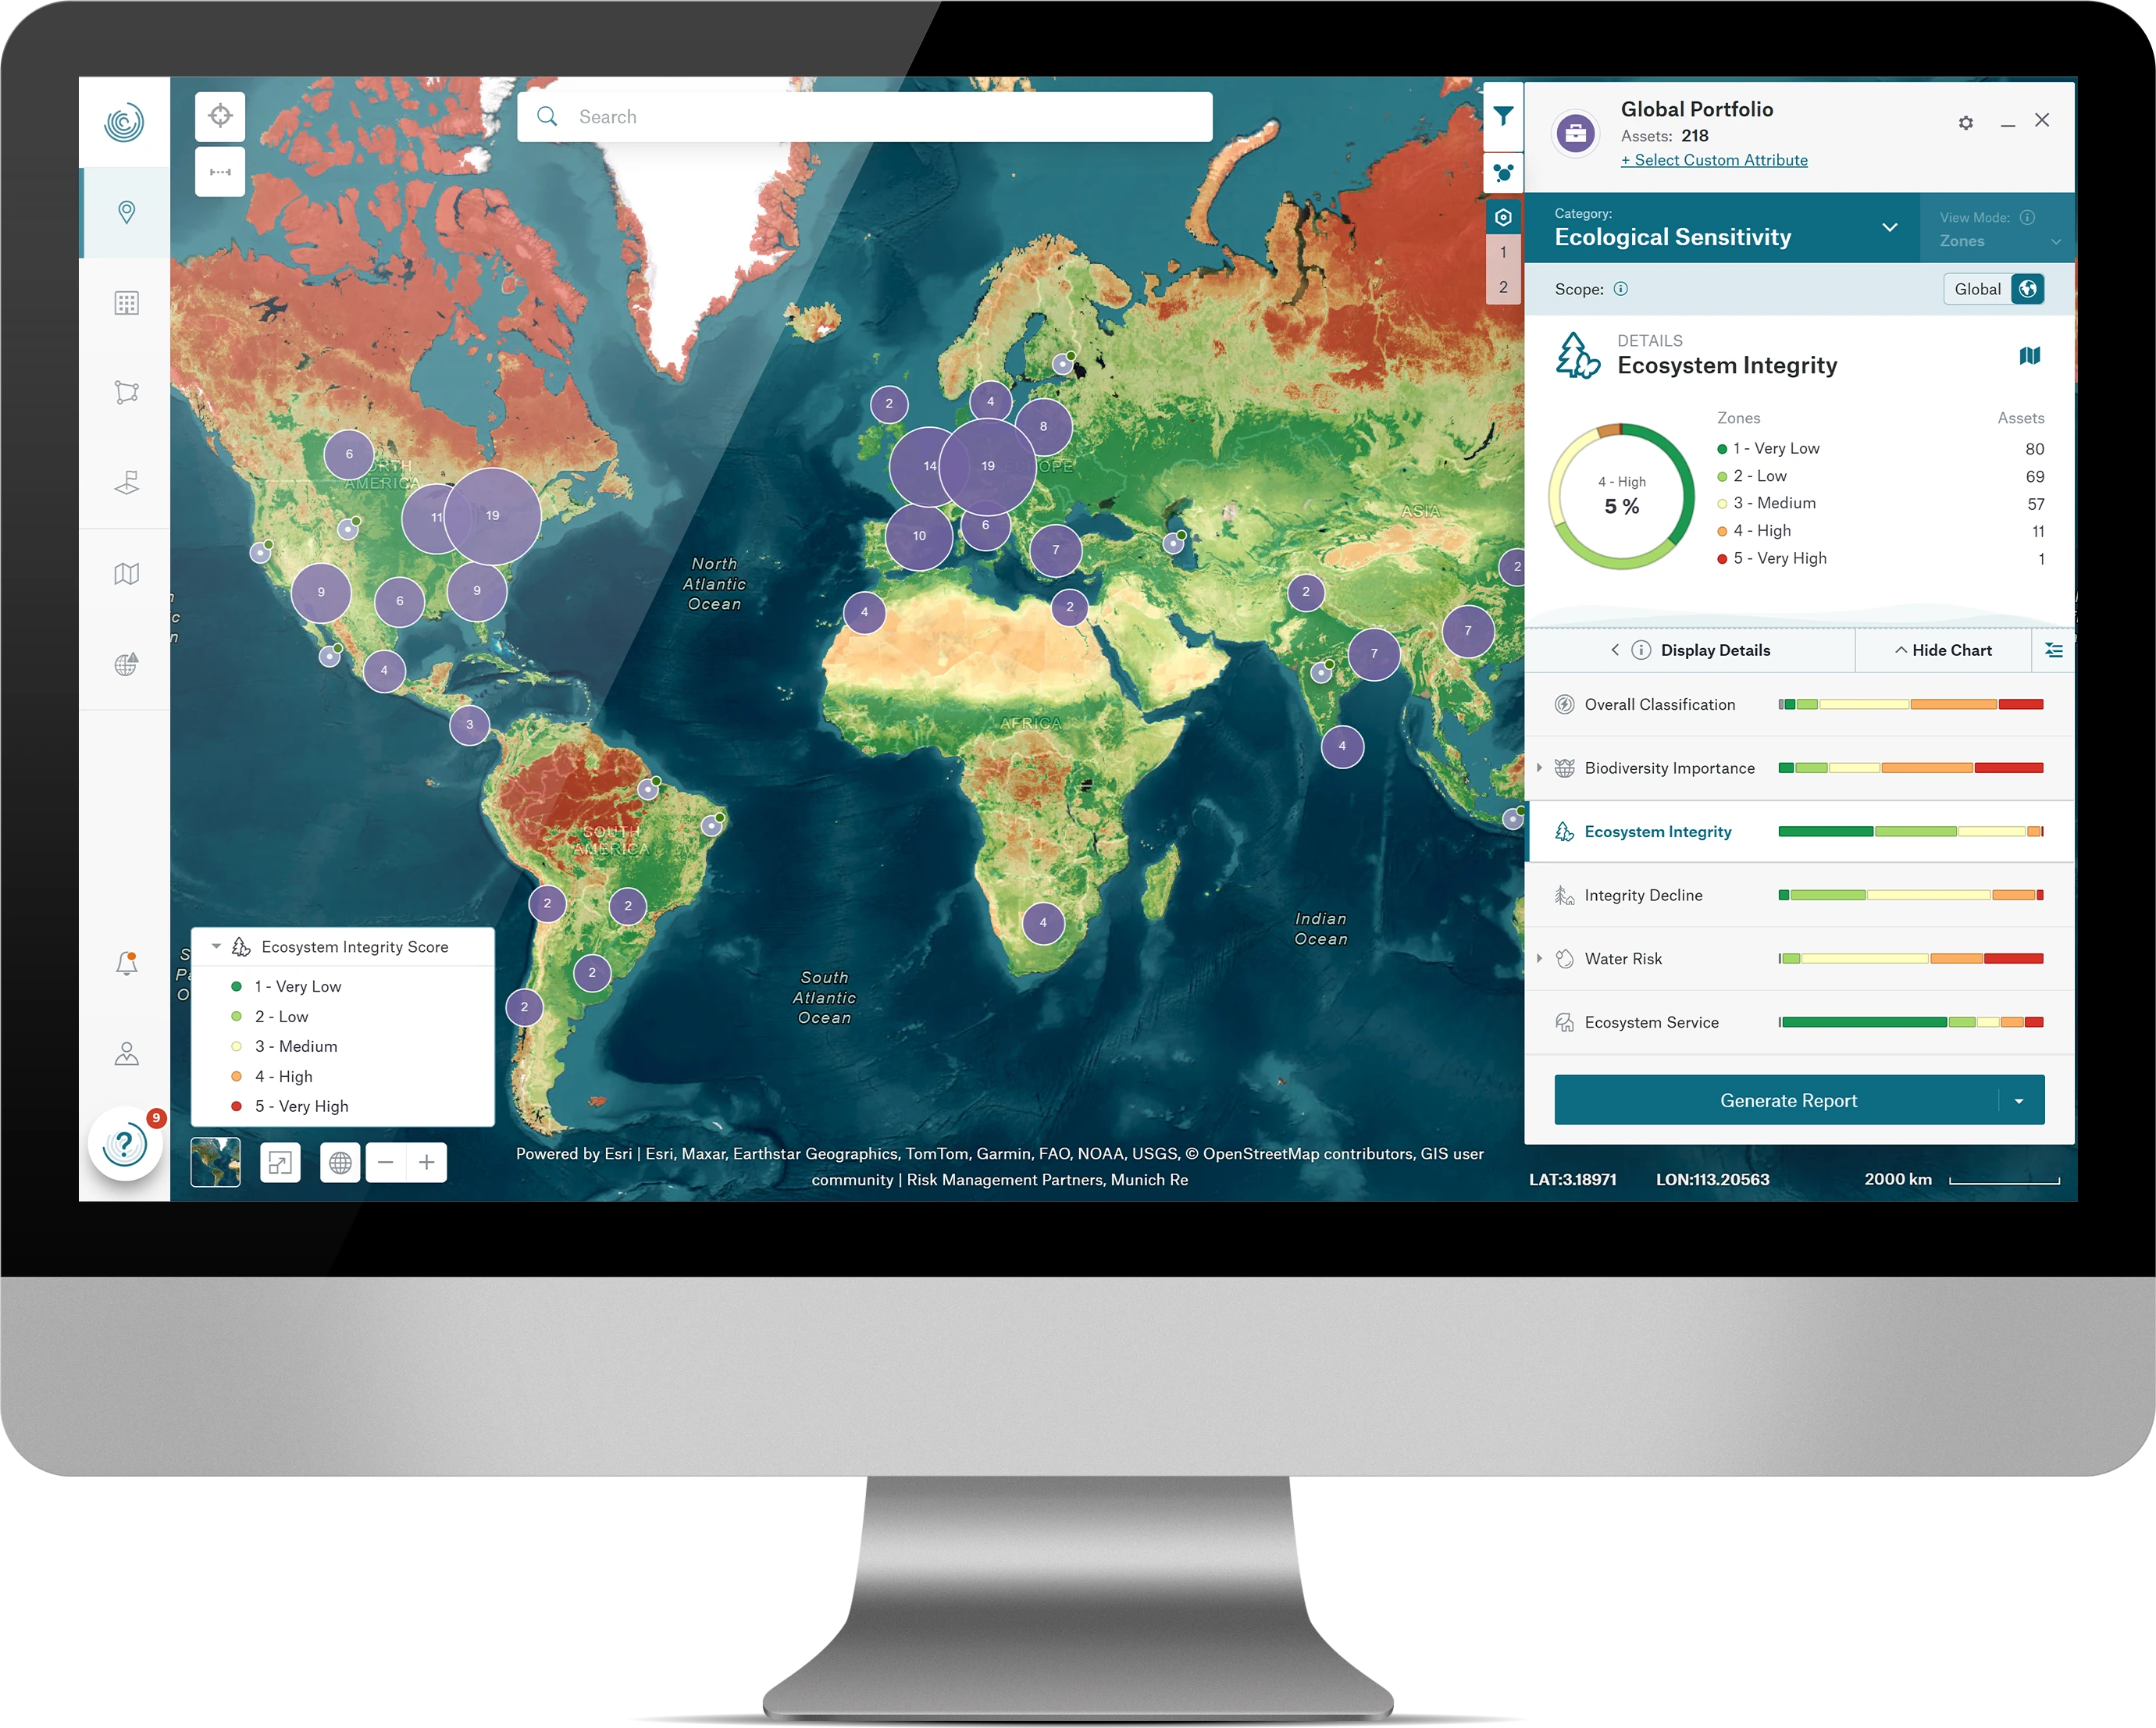
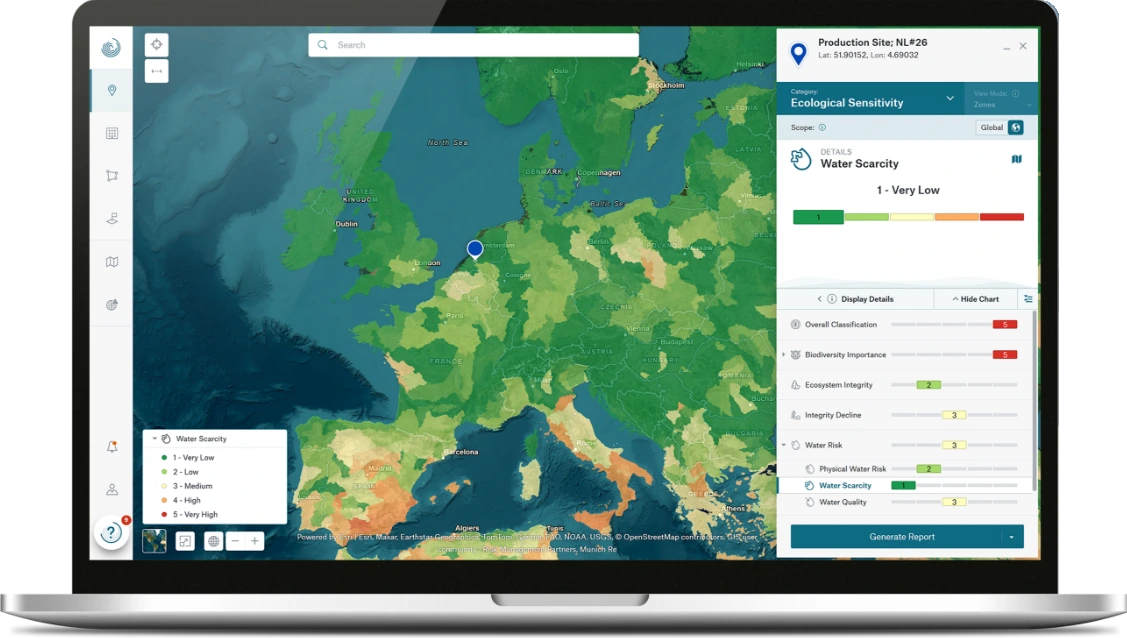
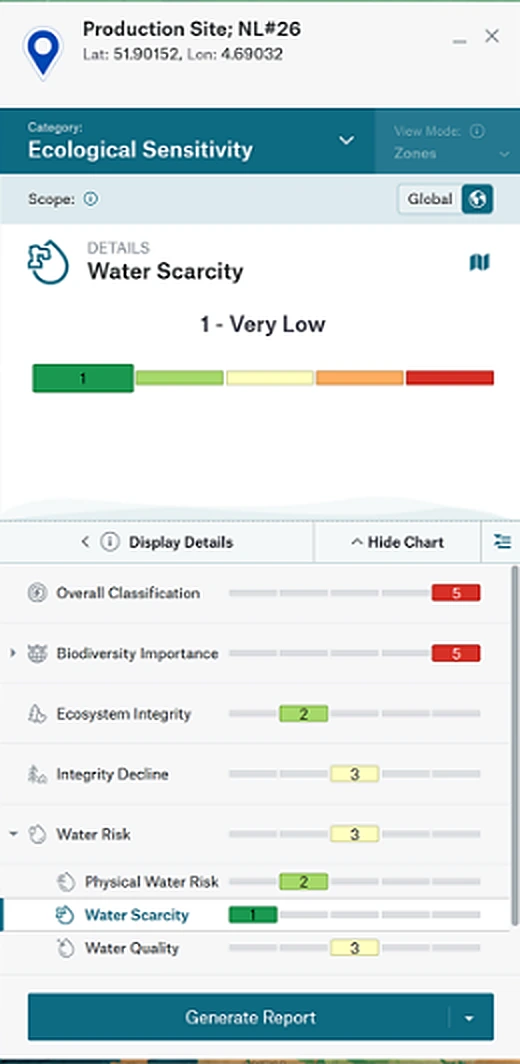
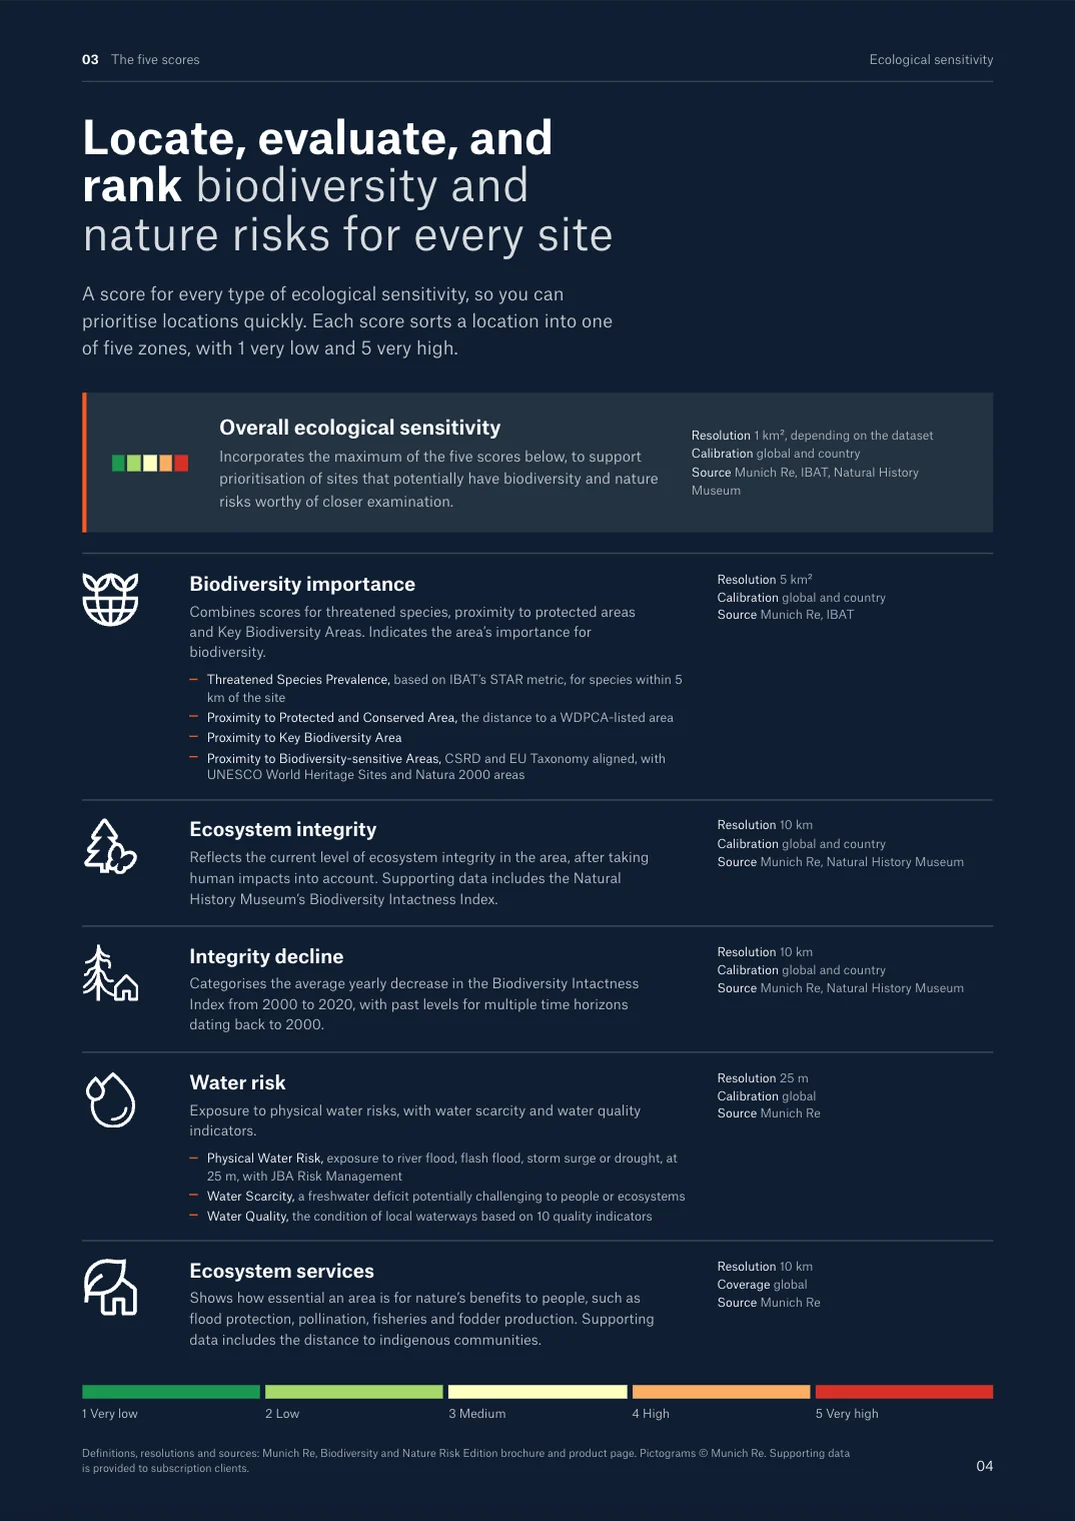
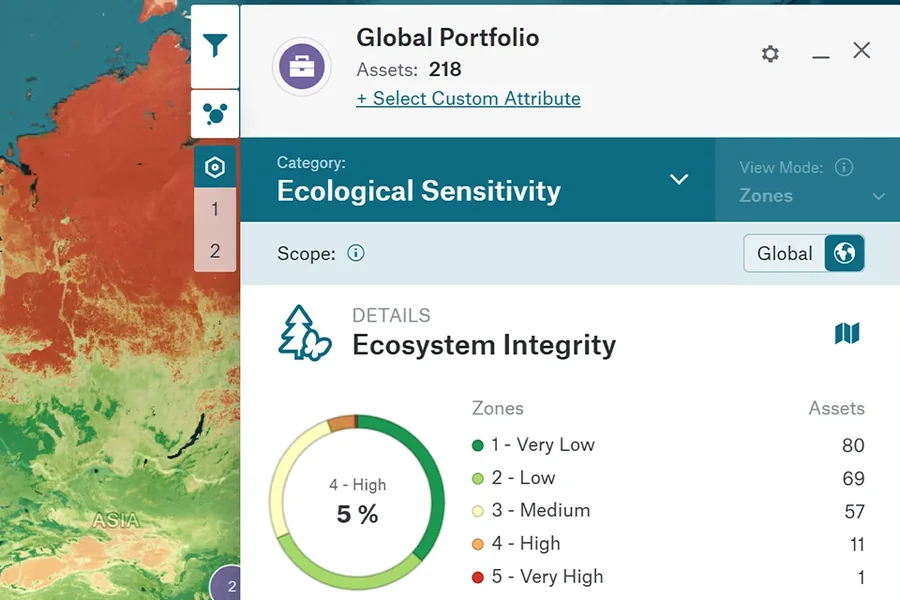
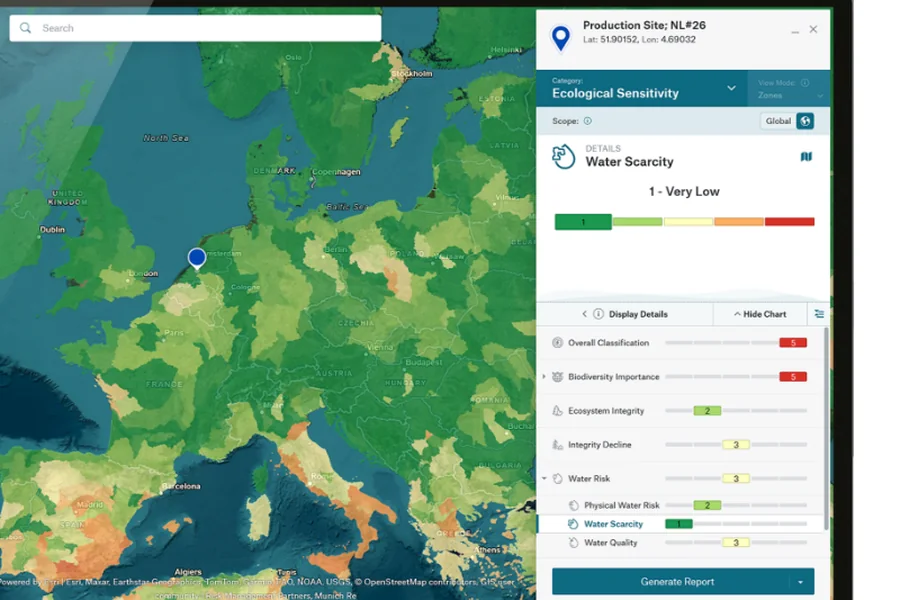
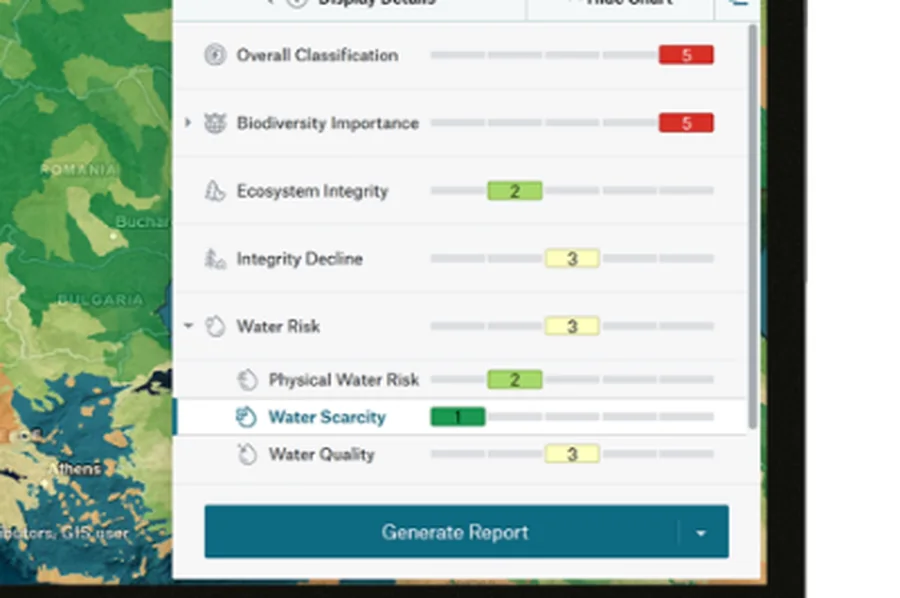
A score for every type of ecological sensitivity, so you can prioritise sites quickly. Scroll through the five scores behind every location.
Pinpoint nature-related interfaces across assets, suppliers and value chains. Enter single sites or upload all of them as an Excel or CSV file.
Combines threatened species prevalence, based on IBAT’s STAR metric, with the distance to protected and conserved areas, Key Biodiversity Areas and biodiversity-sensitive areas.
Reflects the current level of ecosystem integrity in the area, after taking human impacts into account, using the Natural History Museum’s Biodiversity Intactness Index.
The index estimates the percentage of the original number of species that remain, and their abundance.
Categorises the average yearly decrease in the Biodiversity Intactness Index from 2000 to 2020.
Exposure to river flood, flash flood, storm surge or drought, with water scarcity and the condition of local waterways based on 10 quality indicators.
Shows how essential an area is for nature’s benefits to people, such as flood protection, pollination, fisheries and fodder production.
The Overall Ecological Sensitivity Score incorporates the maximum of the five scores, to support prioritisation of sites worthy of closer examination.
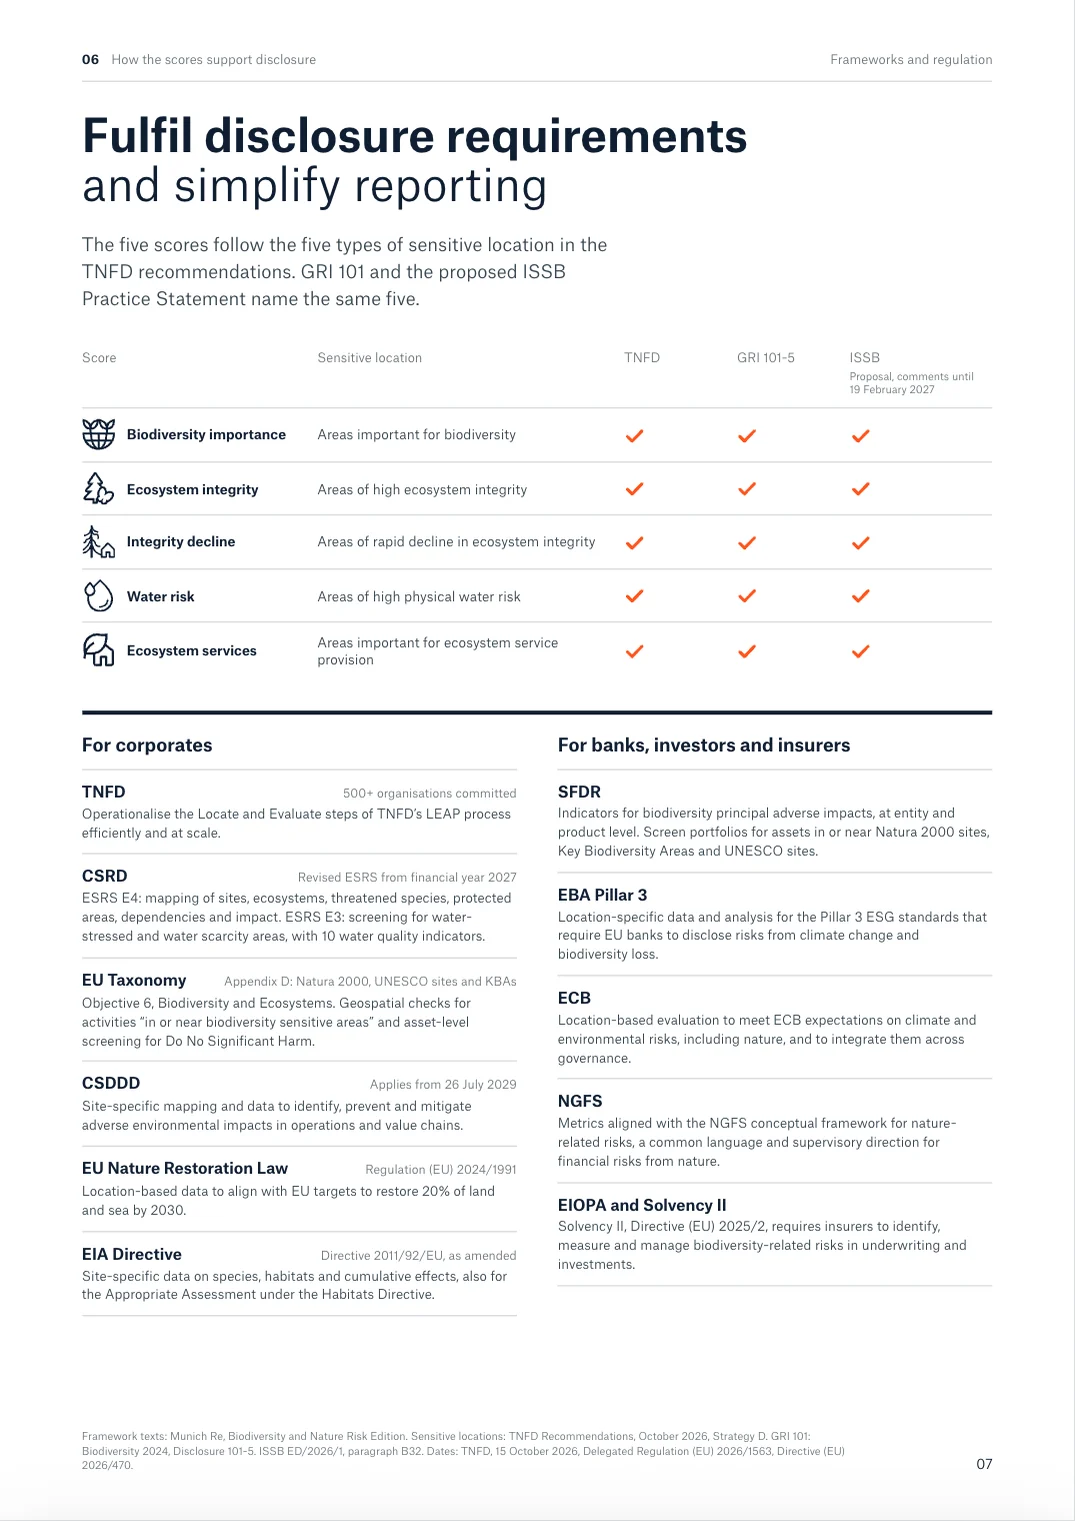
The five scores follow the five types of sensitive location in the TNFD recommendations.5
Schematic illustration
Upload your sites once and assess them in one solution, to streamline CSRD and EU Taxonomy reporting.
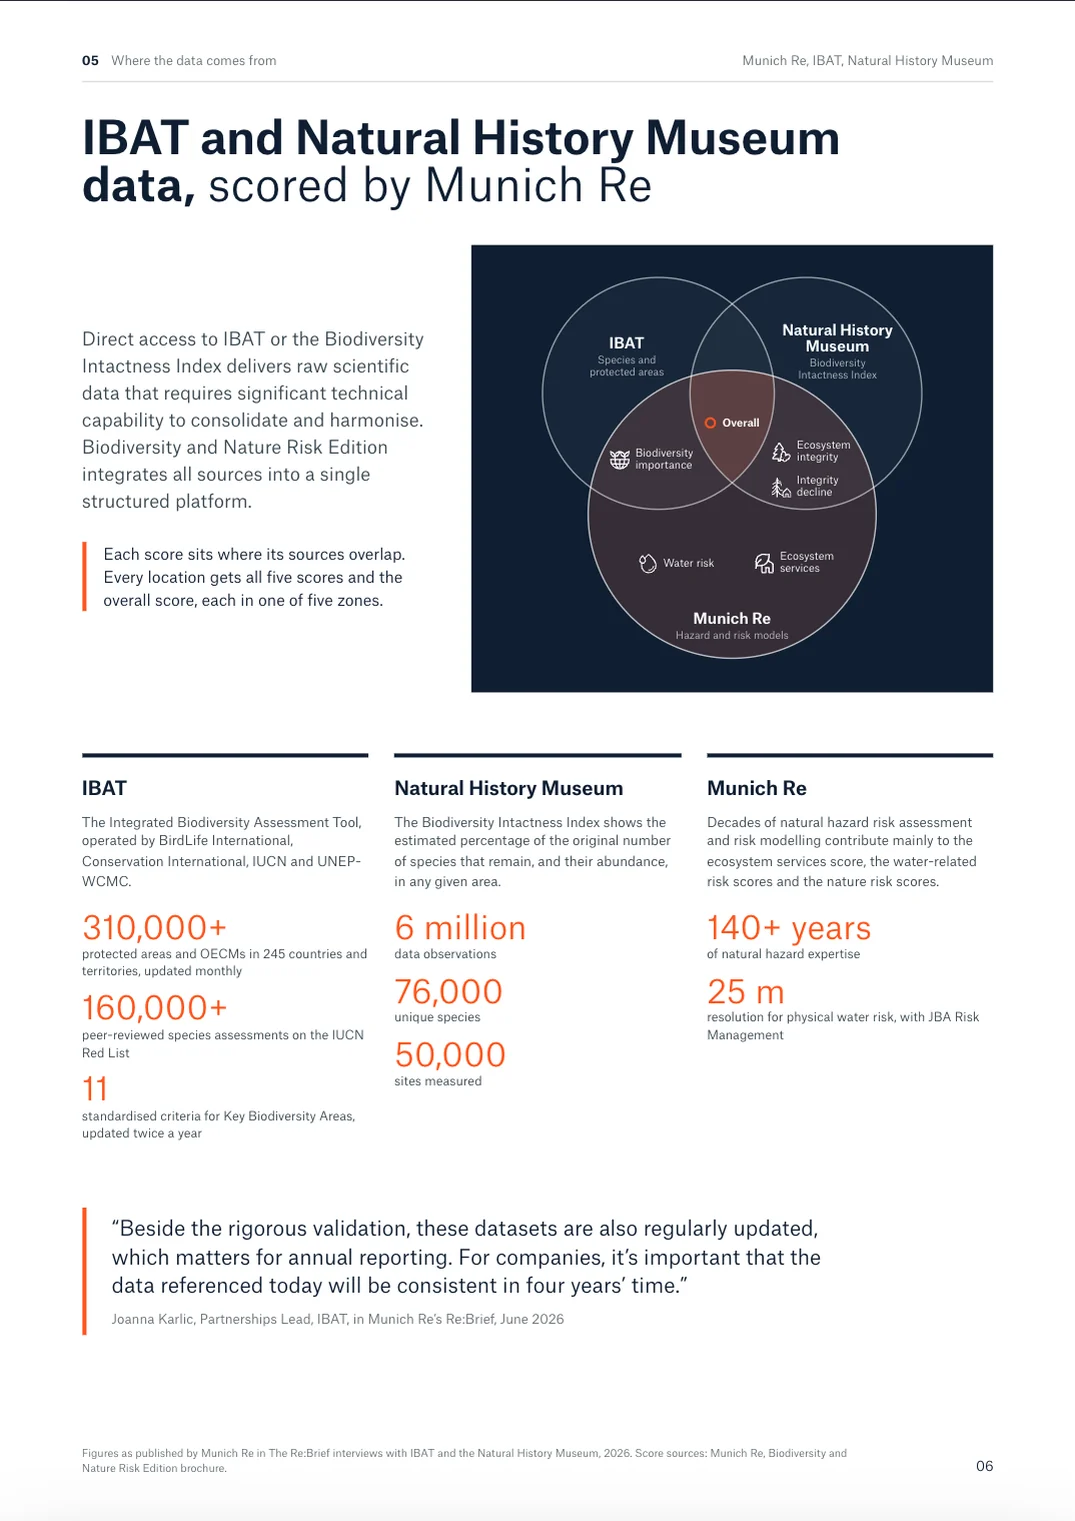
Direct access to IBAT or BII delivers raw scientific data that requires significant technical capability to consolidate and harmonise. Biodiversity and Nature Risk Edition integrates all sources into a single structured platform.8
IUCN Red List, Key Biodiversity Areas and protected areas
310,000+protected areas and OECMs160,000+species assessments
Biodiversity Intactness Index, the share of species that remain
6 milliondata observations76,000unique species50,000sites measured
Decades of natural hazard risk assessment and risk modelling
25 mresolution for physical water risk
Location-specific data and insights are aligned to frameworks such as TNFD, CSRD and the EU Taxonomy. Pick one to see the scores it draws on.
TNFDRuns the Locate and Evaluate steps of LEAP at scale. The five scores follow TNFD’s five types of sensitive location.5
Framework texts from Munich Re. Dates from the IFRS Foundation and the Official Journal of the EU.6
Quotes from Munich Re’s Re:Brief interviews with the people behind IBAT and the Biodiversity Intactness Index.
Clients tell us that having a strong nature strategy helps strengthen stakeholder and investor confidence.
 Nitika AgarwalManaging Director, IBAT
If we’re serious about safeguarding the natural systems that underpin our economies and societies, we need robust data to guide decisions.
 Hannah McCartneyInnovation Unit Programme Manager, Natural History Museum, London
Bringing IBAT data as a layer alongside physical climate risk data is the start of a very powerful way for companies to look at climate and nature risk in an interconnected manner.
 Joanna KarlicPartnerships Lead, IBAT
Quotes and photos from Munich Re’s Re:Brief, 2026.
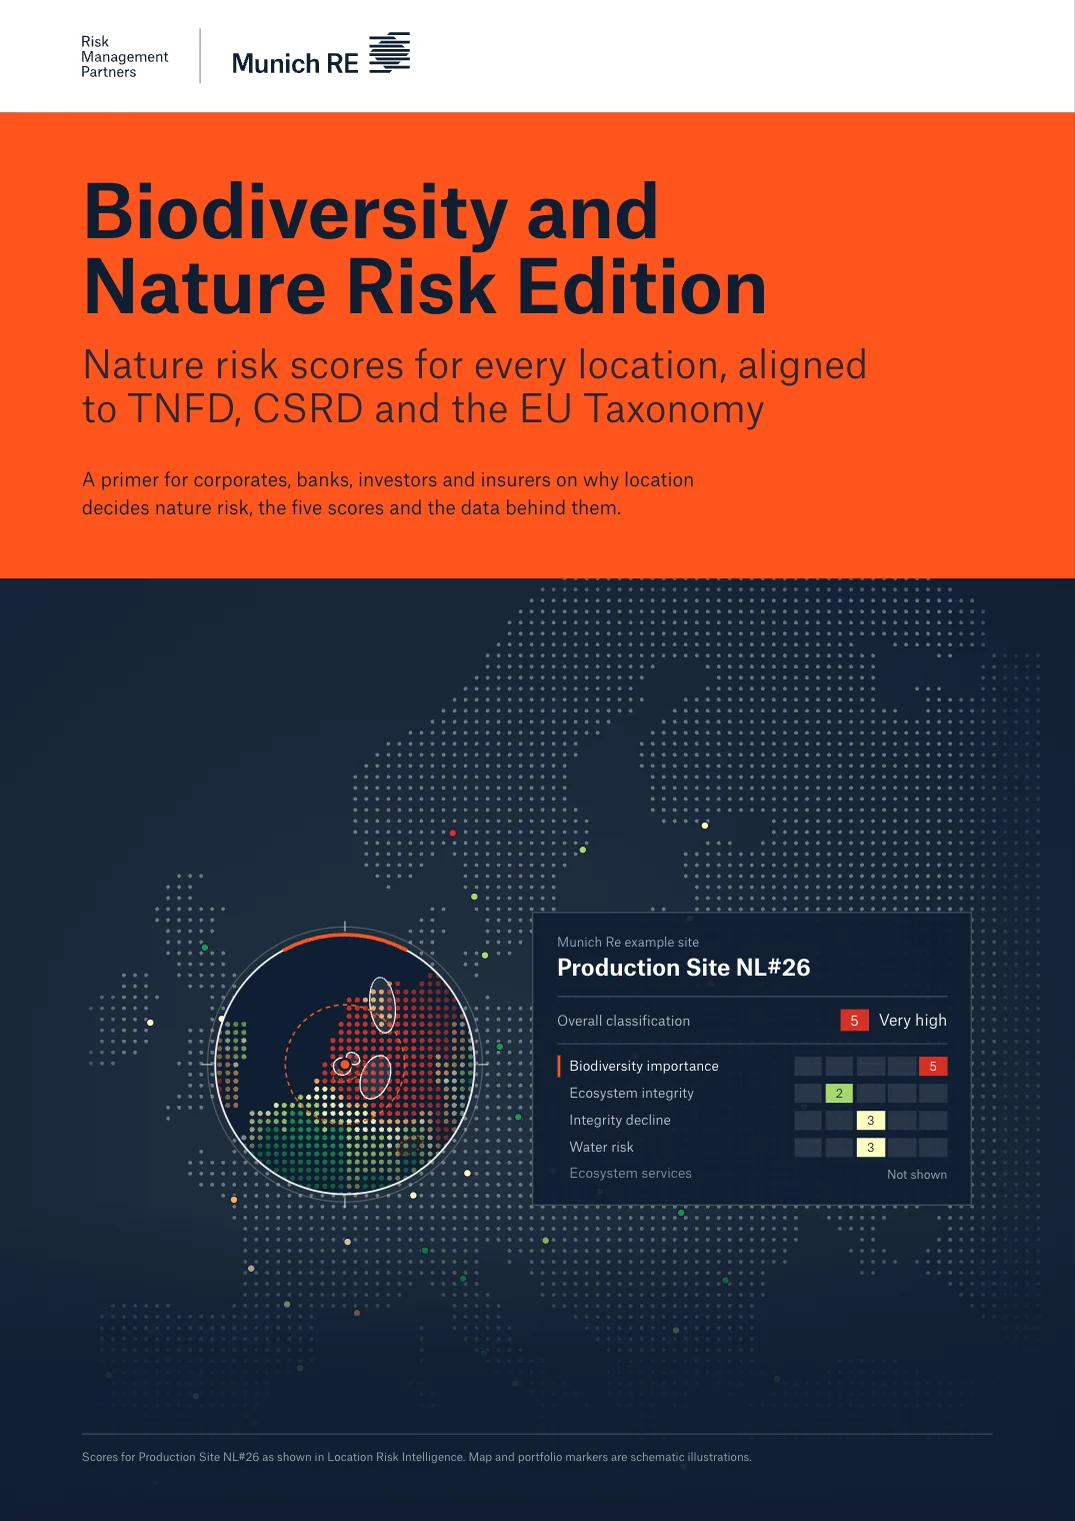
Why location decides nature risk, the five scores and the data behind them.
Biodiversity and Nature Risk Edition is a data edition within Location Risk Intelligence, Munich Re’s advanced SaaS platform for managing physical risks from natural hazards and climate change. Munich Re’s natural hazard expertise is joined by datasets from the Integrated Biodiversity Assessment Tool (IBAT), and the Natural History Museum’s Biodiversity Intactness Index (BII). Its insights are aligned to TNFD, CSRD, EU Taxonomy, among others.
The solution aligns with disclosure requirements across TNFD, CSRD, CSDDD, and EU Taxonomy. Alignment to sector-specific frameworks include EBA Pillar 3, ECB climate and environmental risk guidance, NGFS nature-related risk frameworks, SFDR Biodiversity PAI indicators, and EIOPA/Solvency II biodiversity risk requirements for insurers.
The LEAP process (Locate, Evaluate, Assess, Prepare) is the TNFD’s recommended methodology for identifying and disclosing nature-related dependencies, impacts, risks, and opportunities. Biodiversity and Nature Risk Edition helps you to operationalise the Locate and Evaluate steps at scale, mapping where business activities interface with nature and evaluating their significance.
Direct access to IBAT or BII delivers raw scientific data that requires significant technical capability to consolidate and harmonise. Biodiversity and Nature Risk Edition integrates all sources into a single structured platform, delivers scores in a consistent format, and links biodiversity and nature risk data to Munich Re’s natural hazard and climate risk models.
Banks, asset managers, and insurers use the data for portfolio risk assessment, Pillar 3 ESG disclosure, and PAI reporting. Corporates use it for CSRD and EU Taxonomy compliance, CSDDD supply chain due diligence, and water risk and ecosystem services dependencies. Real estate investors screen for ecologically sensitive locations and reputational risk.
Biodiversity and Nature Risk Edition is integration-ready via API. Because all data sources are harmonised and delivered in an identical format within the Location Risk Intelligence platform, you can automate disclosures and scale nature risk management without custom data engineering.
Fill in the form to get the 10-page primer for corporates, banks, investors and insurers.